Animated Chart Video Maker
Bar and line charts that grow on screen, driven by your data — real motion components, not a screen recording of a spreadsheet and not a baked animation you can never touch again.
From numbers to motion
The chart animates itself — you supply the data and the story.
What you get
Charts made for a phone screen, not exported from a slide deck.
The animation is generated from the values. Change a number and the chart re-animates — no timeline surgery in a video editor.
A screen-recorded spreadsheet or dashboard is unreadable on a phone. These charts are components designed for vertical video.
Q3 got revised? Open the scene, fix the value, re-render. Scenes are layered objects — text, data, colors, and timing all stay adjustable.
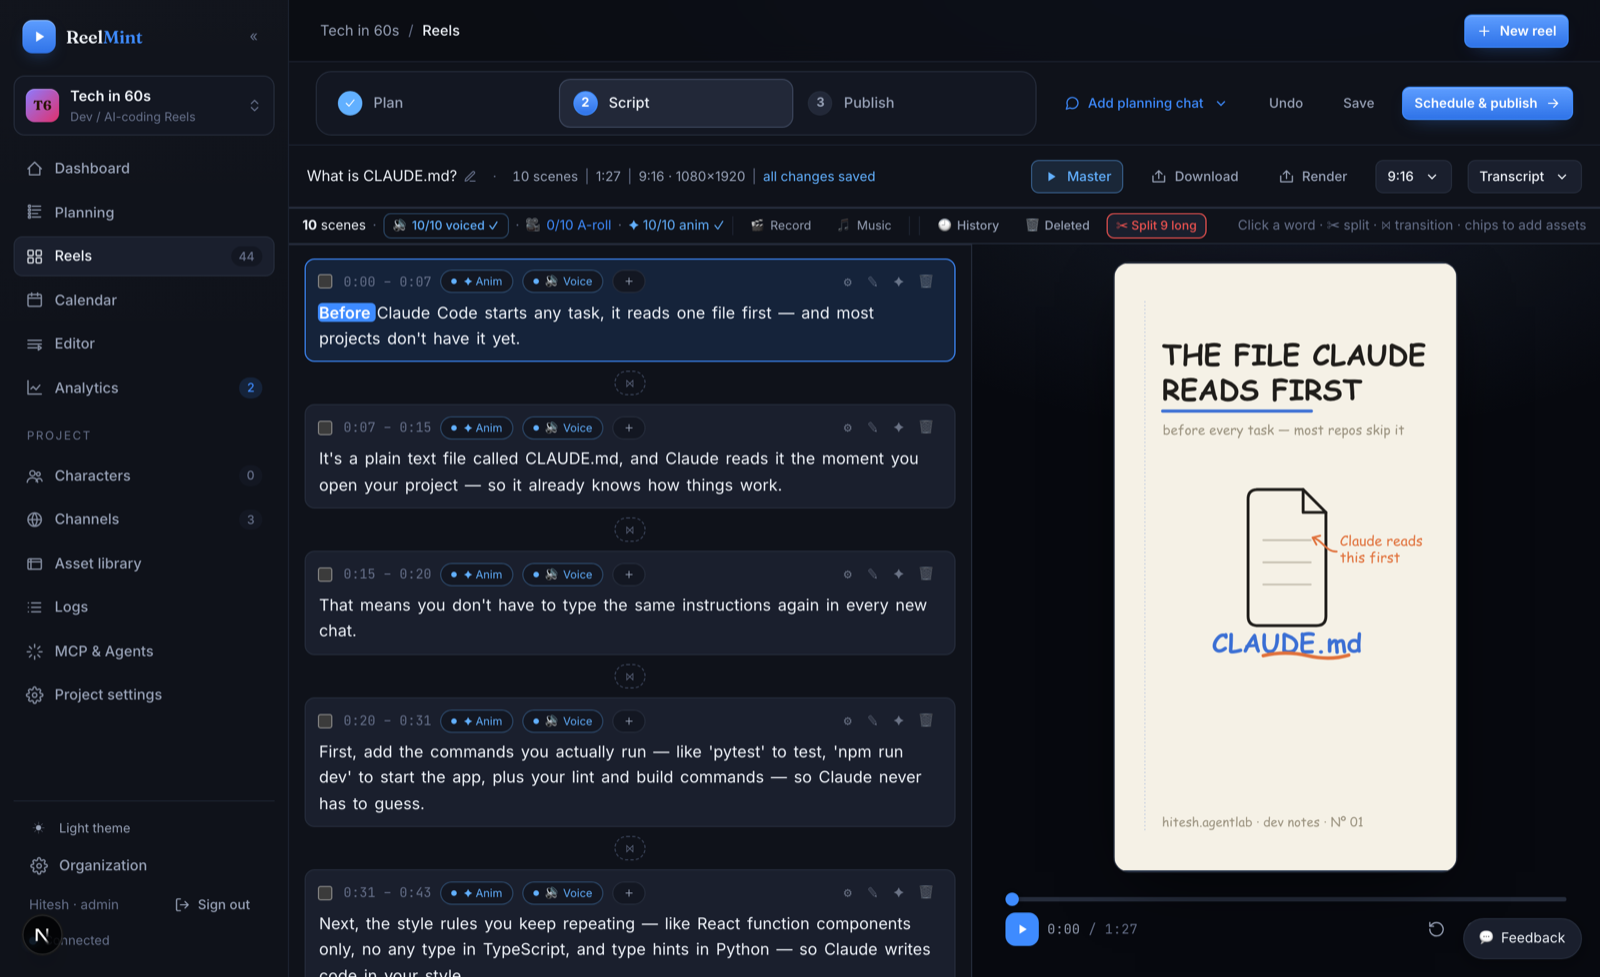
Pair the chart with a code card for the query, a terminal for the benchmark run, a timeline for the rollout — 100+ components in one editor.
Voice-sync ties scene duration to the read, so the punchline number lands with the sentence that explains it.
No credit card, no watermarks, no credits system — AI usage runs on your own provider keys with zero markup.
Common questions
How do I get my data in?
Type or paste the values into the chart component. The growth animation is generated from the data itself — there is nothing to keyframe.
Can I match my brand's colors?
Yes — scene properties like colors stay editable per component, and per-project style keeps reels consistent. You can also train a style from a reference reel.
What chart types are available?
Bar and line charts are the data-driven core, alongside diagrams, timelines, and 100+ other motion components you can mix into the same Short.
My numbers changed after I rendered — now what?
Open the scene, edit the values, re-render. The chart is a live component, not baked pixels, so a revision takes minutes, not a remake.
What does it cost?
ReelMint is free during the founding-creator pilot. Generation runs on your own API keys, billed by the provider with zero markup.
Make the numbers move
Bring one dataset and publish an animated chart Short this week — free during the pilot.
Start free — no credit card